
SmartTrader Guide for South African Traders
📊 Navigate SmartTrader with ease—discover features, risks, and tips for South African traders. Get insights on setup, strategies, and support! 🇿🇦
Edited By
George Mitchell
TradingView charts have quickly become a staple for many traders and investors in South Africa. Whether you’re watching the JSE Top 40, tracking commodity prices like platinum or gold, or following forex pairs involving the rand, TradingView offers a powerful platform to analyse markets in real time.
At its core, TradingView brings together price data, technical studies, and customisable chart layouts all in one easy-to-navigate interface. But it is not just about pretty charts; it’s about turning data into insights that guide smarter decisions. For South African traders, understanding the finer points of how to access localised data, set up charts relevant to the rand and regional stock exchanges, and apply technical indicators suitable for local market behaviour is vital.

Consider the example of a trader monitoring a rand/US dollar forex pair. Quick access to live price updates with TradingView’s flexible alert system can make the difference between catching opportunity or missing out due to delays. Similarly, investors watching dividend announcements on South African blue-chip stocks will want charts they can tailor with annotations, timeframe adjustments, and overlays, all saved for quick reference.
Pro tip: Get comfortable with TradingView’s drawing tools to mark support and resistance lines or identify trend channels. This keeps charts relevant to your specific trading style and market conditions.
TradingView’s user-friendly layout helps you customise what you see—from candle types and chart colours to setting up multi-chart views for comparing assets side by side. Plus, its rich library of technical indicators lets you add, modify, or create your own studies to suit patterns common in South African trading.
In this guide, we’ll walk through practical steps to make TradingView work for you locally. That includes quick setup tips for chart views, selecting relevant indicators, linking with South African market data sources, and optimising charts for the realities of our trading environment (think: loadshedding interruptions or data cost considerations).
By mastering these elements, you’ll be better equipped to read market signals promptly and act decisively—whether you’re a day trader in Johannesburg, a swing trader in Cape Town, or an analyst managing risk from Durban.
Let's start by looking at how to get your TradingView charts set up to reflect South African market realities.
Grasping the basics of TradingView charts sets the foundation for effective market analysis. For South African traders, understanding these elements helps in making timely decisions, whether trading JSE stocks or tracking forex pairs. The platform’s design suits both beginners and experienced users, but knowing how its core features work gives you an edge in interpreting market movements accurately.
TradingView is a web-based charting platform that provides comprehensive tools for analysing financial markets in real-time. It combines ease of use with powerful features, allowing traders to monitor price actions, apply indicators, and manage watchlists from any device. This flexibility is especially handy in South Africa, where traders often switch between desktop and mobile during the day.
The platform supports a wide range of markets including equities, forex, commodities, indices, and cryptocurrencies. South African traders benefit from access to local instruments like JSE-listed shares, as well as global assets, giving a broad spectrum for portfolio diversification. Whether you’re keeping an eye on the Rand-Dollar (ZAR/USD) exchange rate or following Brent crude prices, TradingView’s broad market coverage makes it practical for local use.
Accessing TradingView in South Africa is straightforward. The web platform works well on average internet connections common in many parts of Mzansi, although a stable connection will ensure smoother data flow. The free version offers plenty for casual users, while the paid plans unlock advanced features — handy if you want multiple charts open or priority data feeds particularly relevant for volatile markets.
Price representations come mainly in three forms: bars, candlesticks, and lines. Candlesticks are preferred by many traders as they visually display open, close, high, and low prices within a set timeframe, revealing bullish or bearish pressure clearly. For example, a long green candle on a JSE stock graph indicates strong buying interest during that period.
Timeframes define the period each price element covers, ranging from one minute up to monthly intervals. Choosing the right timeframe depends on your trading style—day traders often rely on shorter frames like 5 or 15 minutes, while longer-term investors monitor daily or weekly charts to track broader trends. Adjusting intervals helps you zoom in or out on market rhythms critical to different strategies.
Chart layouts and panels offer ways to organise how you view data. You can open multiple charts side by side, compare instruments, or stack indicators in separate panels beneath the main price chart. This customisation helps South African traders, for example, track a JSE share price alongside the ZAR/USD forex rate in real-time, all within one workspace. Saving these layouts saves time, ensuring quick access to your preferred analysis setup.
Getting comfortable with these basic chart elements is the first step to mastering TradingView. They provide the building blocks to spot patterns, understand market sentiment, and make informed trading decisions adapted to South Africa’s financial landscape.
Tailoring your TradingView charts to suit your unique trading style makes it easier to spot opportunities and make quick decisions. Chart customisation isn’t just about looks—it’s a strategic step that helps clarify market data and reduces visual clutter. Especially for South African traders who may juggle multiple assets like JSE stocks, global forex pairs, and commodities, setting up charts that highlight what’s most relevant can save valuable time.
Changing the colours on your chart is one of the simplest ways to improve readability. For instance, switching the candlestick colour scheme from the default green and red to something less harsh on the eyes, like soft blues and greys, can reduce strain during long trading sessions. This matters when you’re tracking volatile markets like the rand-dollar pair, as you want to avoid losing focus due to glaring colours.
The theme choice—light or dark mode—also impacts how comfortable you feel using the platform. Many traders prefer dark themes for night-time sessions, while daylight traders might choose lighter themes to combat glare. TradingView lets you quickly flip between these, matching your environment.
Using several charts side-by-side allows you to monitor different timeframes or assets simultaneously without hopping between tabs. For example, you might set four charts: one showing the 1-hour chart for the JSE Top 40 index, another with a daily view of BTC/USD, a third showing commodity trends like gold, and the last tracking ZAR/USD forex. This split-view setup helps catch correlations or divergences early, an advantage when Eskom’s loadshedding impacts market liquidity or volatility.
TradingView supports easy drag-and-drop to adjust your layout and even lets you save these multi-chart workspaces so you can jump right back in next time.
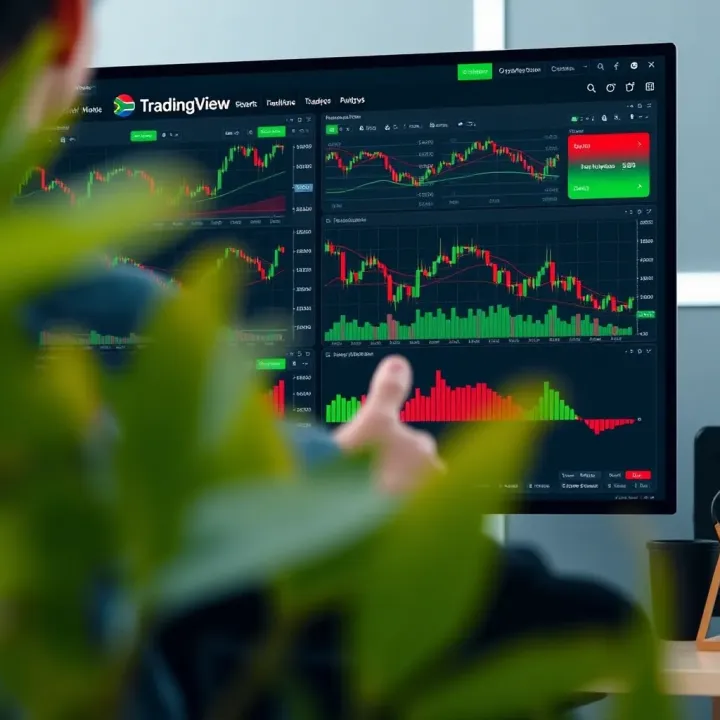
Once you’ve set your preferred chart style, indicators, and timeframe, saving these settings as a template saves repeating the work later. Whether you prefer daily candlesticks with RSI and Bollinger Bands or a more minimal setup, templates mean less fiddling and more trading.
For South African traders moving between desktop and mobile (where data bundles can be pricey), loading saved templates cuts down on data use by avoiding unnecessary reloads or adjustments. Plus, if you share your setups with colleagues, templates ensure everyone’s on the same page.
Drawing trendlines to connect price lows or highs helps define market direction. For instance, plotting an upward trendline on a Sasol share chart might reveal steady support despite global oil price swings. Channels build on this by marking parallel support and resistance lines, helping traders spot breakouts or reversals.
These tools are essential for quick visual cues. When the price breaks below a trendline or out of a channel, you get a heads-up to reassess your position—a useful feature in markets affected by unpredictable local news or commodity price shifts.
Marking horizontal lines where price has repeatedly stalled or reversed can help anticipate future moves. For example, identifying a strong resistance level at R400 on a Naspers share might warn you to book profits before a possible dip.
Support and resistance spotting is considered one of the simplest yet most effective tactics, especially in volatile environments. Drawing these levels on your chart helps filter noise from genuine market reactions.
Adding brief notes or labels to your chart adds context to your analysis. Maybe you tag a point where SARS announced a tax change affecting retail shares or note an upcoming concerted group buy by institutional investors.
Annotations help remember why a particular level or indicator was significant at a glance. This feature is handy when reviewing past trades or sharing charts with your trading group or advisor. The clarity helps in crafting more thoughtful strategies and avoiding repeated mistakes.
Personalising your TradingView charts sharpens your trading edge by making market movements clearer and more actionable, right in line with local trading realities and schedules.
Technical indicators are core to chart analysis on TradingView, helping traders make sense of price movements and market momentum. In the South African trading scene, where markets can be volatile and influenced by local factors like political events or commodity price swings, these tools provide clarity and assist traders in finding trading opportunities. Using the right indicators enables quicker, more informed decisions, whether you're trading JSE stocks, forex pairs like USD/ZAR, or commodities such as gold and platinum.
Moving averages smooth out price data to show trends more clearly. A simple moving average (SMA) calculates the average price over a set number of periods, while the exponential moving average (EMA) gives more weight to recent prices, making it more responsive. For example, a 50-day EMA on a JSE stock chart can help spot upward or downward trends early, crucial for timing entry or exit points. EMAs often suit fast-moving instruments like forex better, whereas SMAs are preferred for steadier stocks.
RSI measures momentum by indicating when an asset is overbought or oversold, typically on a scale from 0 to 100. Values above 70 often suggest a potential price drop, while readings below 30 may indicate a rebound. In the context of South African equities, traders might use RSI alongside earnings reports to gauge whether a share price is stretched too far, helping to avoid chasing trades during short-term bubbles.
The Moving Average Convergence Divergence (MACD) shows the relationship between two EMAs to spot trend changes and momentum shifts. South African traders often look for MACD crossovers—when the MACD line crosses its signal line—as buy or sell signals. Meanwhile, Bollinger Bands use a moving average with upper and lower bands set by volatility. When prices hit the bands, it can indicate potential reversal zones. For instance, mining shares with high volatility might hit the upper Bollinger Band before a pullback.
Some indicators, like moving averages, appear directly on price charts as overlays, offering context without clutter. Others, such as RSI or MACD, occupy separate panels below the chart, providing focused momentum or volume insights. Traders should honestly assess what works best for their style—for example, seeing moving averages alongside candlesticks helps with trend clarity, while keeping RSI separate avoids overcrowding the main chart.
It's tempting to add many indicators hoping for certainty, but too many can cause confusion or mixed signals. A rule of thumb is to stick to two or three well-understood indicators. For example, combining a 20-day EMA for trend direction with RSI for momentum alerts often suffices. Too much data can slow decisions, especially in fast-moving South African markets influenced by loadshedding or news events.
Interpreting indicators isn’t about a mechanical reaction to signals but understanding their context. An RSI below 30 might suggest oversold conditions, but if the overall trend is downwards, the price can remain low for longer. Likewise, a MACD crossover is stronger when it aligns with support or resistance levels on the chart. Wise traders blend indicators with price action analysis and market news, recognising signals as tools—not guarantees—to improve their odds.
Combining a few well-chosen indicators and knowing how to interpret their signals increases your trading edge on TradingView without drowning you in data. In South Africa’s dynamic markets, this balance proves especially valuable.
TradingView offers plenty of tools, but making the most of those tailored for South African traders can really sharpen your decision-making. Access to local market data, practical alert settings, and integration with mobile notifications helps you stay ahead without missing a beat. This section zeros in on features that matter most to traders working with JSE shares, local forex pairs, and commodities that influence our economy.
Having live, accurate data from the Johannesburg Stock Exchange (JSE) is crucial for local traders. TradingView covers a wide range of JSE-listed companies, from large blue-chip firms like Sasol and Naspers to smaller-cap stocks. This means you can analyse price trends and volume changes in real-time, aiding in well-informed buy or sell calls. For instance, tracking how Anglo American responds to global commodity shifts or how MTN reacts to regulatory news helps you time entries and exits better.
South African traders often watch the rand (ZAR) closely alongside major pairs like USD/ZAR or EUR/ZAR. TradingView provides charts for these forex pairs, enabling you to spot exchange rate swings affecting imports, exports, and investments. Likewise, commodities such as gold, platinum, and even oil have direct bearing on the local economy. With TradingView’s comprehensive data, you can correlate commodity price movements with JSE resource stocks or currency trends, facilitating a holistic trading perspective.
While TradingView offers extensive market data, free users may face delays or restricted access, especially for JSE intraday quotes. To bypass such limits, subscriptions to TradingView’s Basic, Pro, or Premium plans offer real-time data feeds and more charting options. Traders weighing costs should consider how up-to-date data impacts their strategy—paying for live streams can prevent missed opportunities or costly delays in volatile markets.
Alerts in TradingView notify you instantly when prices cross key levels or when technical indicators signal entry or exit points. For example, setting an alert for the RSI dropping below 30 on a particular JSE stock could flag a potential oversold condition worth watching. This saves you from staring at charts around the clock and helps you react swiftly when your conditions trigger.
The TradingView mobile app delivers alerts right to your cellphone, which is handy for South African traders who might be on the go or dealing with loadshedding interruptions. Instant notifications ensure you don’t miss critical price moves or breakout signals, allowing you to stay connected regardless of being at your desk or out and about.
Combining alerts with your broader strategy means you can automate part of your monitoring process. For example, if your strategy involves buying a share once it breaks above a resistance level and the MACD confirms momentum, you can set separate alerts and link these conditions mentally or through TradingView’s alert logic. This reduces guesswork and keeps your trades aligned with your plan without constant manual tracking.
Staying ahead in South African markets requires both smart charting and timely information. Customising TradingView to access local data and harness alerts can give you that edge, keeping you informed and ready to act when it counts.
Efficient use of TradingView charts can greatly enhance your trading accuracy and speed, especially when market conditions shift rapidly. For South African traders, where moments lost might mean missed opportunities due to local market volatility or connectivity hiccups, practical charting tips matter. These tips help reduce clutter, speed up analysis, and ensure you act on insights without delay.
Managing chart complexity is crucial. Loading numerous indicators, multiple timeframes, and graphic overlays all at once can bog down your computer or browser, especially on older laptops or during peak internet traffic times. For example, relying on five or six heavy indicators like Bollinger Bands, MACD, and RSI alongside multiple drawing tools often slows rendering and can cause delayed response times. Simplify by choosing the most relevant indicators and hiding rarely used drawing layers, which helps charts load faster and keeps your focus sharp.
Handling multiple charts and workspaces efficiently allows you to compare assets or timeframes without jumbling your screen. TradingView lets you save different workspaces, so you might have one for JSE shares, another for commodities like gold or platinum, and yet another for forex pairs like ZAR/USD. Switching between these setups can be done quickly, avoiding constant reloading or reconfiguration. This setup is especially helpful during volatile sessions, such as when the JSE opens or close, or when international markets impact local prices.
Internet connection in South Africa is another real consideration. Many traders experience varying data speeds, so it's smart to manage chart complexity accordingly. Lightweight chart layouts with fewer indicators use less bandwidth and load faster, which is a boon when your home fibre or mobile data struggles during power outages or peak hours. Some traders also run TradingView offline briefly by caching chart data, helping reduce disruption when signals lag.
Connecting TradingView seamlessly with your broker streamlines trade execution. Brokers like Easy Equities and Standard Bank’s online trading services support direct TradingView integration, so you can place orders directly from a chart without toggling between platforms. This not only saves time but reduces the chance of costly errors when copying price levels manually.
Exporting data and sharing charts enable collaboration or record-keeping. You might want to save a series of snapshots of market setups for later review or to discuss strategies with peers. TradingView supports exporting chart images or even detailed trading data in formats compatible with spreadsheet software. Sharing setups with your investment club via shared links or screenshots encourages better collective market understanding.
Utilising TradingView community scripts lets you tap into local trader expertise. The platform’s vast library includes scripts and customised indicators created by users worldwide, including some tailored for South African markets, like scripts for tracking Eskom loadshedding impact on sector stocks or custom forex volatility measures. Testing these scripts alongside your strategies can bring fresh insights and improve your edge.
Efficient charting isn’t about cramming your screen with info — it’s knowing what to keep, when to execute, and how to keep your tools responsive even under local technical constraints.
The practicality of these tips means your time spent analysing charts translates better into clear, confident decisions on the JSE or forex desk, even when things get hectic or your connection isn’t at its best.
📊 Navigate SmartTrader with ease—discover features, risks, and tips for South African traders. Get insights on setup, strategies, and support! 🇿🇦
Explore PocketOption in-depth: learn to set up accounts, navigate trades, manage risks, and check compliance—all tailored for South African traders 📊🇿🇦
📈 Learn how Contracts for Difference (CFDs) let South African traders speculate on markets without owning assets, explore risks, strategies, and local regulations for smarter trading.

🔍 Explore BlackBull Markets' forex, indices, commodities, & crypto offer for South African traders. Get the lowdown on accounts, fees, platforms & safety. 💼
Based on 6 reviews