

Understanding No Loss Derivative Bots
🤖 Explore no loss derivative bots in trading: how they operate, their benefits, risks, and impact on South African markets for savvy investors.
Edited By
Henry Collins
Derivative functions, or "deriv fx" as some call them, are all about understanding how things change. For traders, investors, financial advisors, brokers, and analysts, this concept is particularly useful. After all, markets and asset prices rarely stay still, so knowing how to measure the rate at which values shift is a big help.
At its core, a derivative function tells you the rate of change of a quantity compared to another—usually time or another variable. For example, if you're tracking a share price, the derivative tells you how fast the price is rising or falling at any moment. It's like checking the speedometer of a bakkie on the N1 highway rather than just knowing the total distance covered.
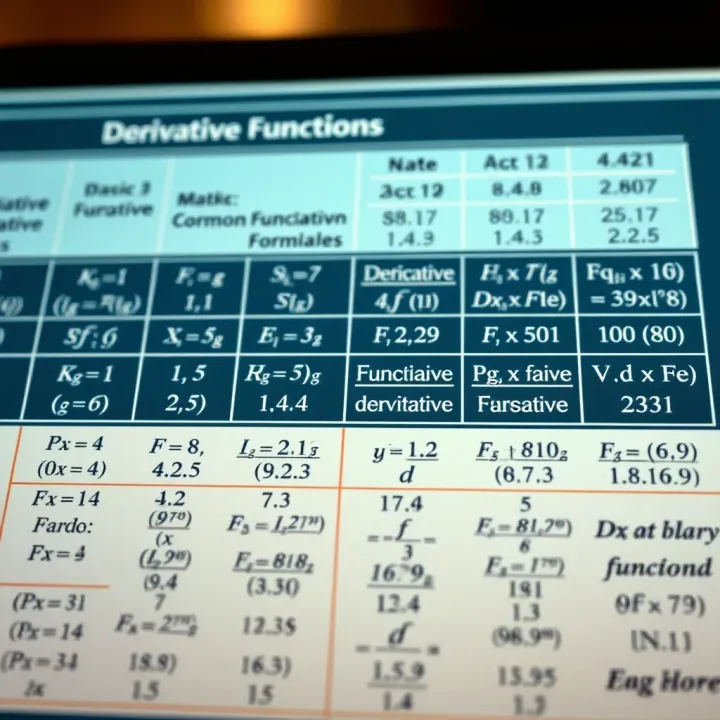
Understanding derivatives allows you to spot momentum, detect turning points, or estimate volatility. If an asset price's derivative is positive and growing, it shows accelerating gains. Conversely, a negative derivative suggests the price is dropping. Sudden sharp changes in the derivative can signal trouble ahead or opportunities worth investigating.
Calculating a derivative usually involves the process of differentiation—the mathematical way of finding instantaneous rates of change. For straightforward functions, such as f(x) = x², the derivative is 2x, meaning the slope or speed of change increases as x grows. In financial models, derivatives can be more complex, incorporating exponential or logarithmic functions, which better capture real-world dynamics like compounded interest or diminishing returns.
"Derivatives break down price movements into understandable, measurable changes, giving financial players an edge in timing decisions."
To calculate derivatives effectively, some fundamental rules apply:
Power Rule: Differentiates powers of x, e.g., xⁿ → n·xⁿ⁻¹
Product Rule: Used when differentiating products of two functions
Quotient Rule: Applies when functions are divided
Chain Rule: Helps with composite functions, allowing you to differentiate complex nested expressions
Grasping these rules opens the door to analysing various functions seen in financial markets.
Derivatives help you anticipate price behaviour by quantifying momentum and volatility quickly, giving you a sharper edge. For instance, analysing the derivative of an option's price against the underlying asset highlights sensitivity—what traders call "the Greeks". These insights support smarter entry and exit points, better risk management, and clearer spotting of trend reversals.
In summary, thinking in derivatives equips financial professionals with tools to measure and interpret constant market shifts, rather than just observing static values. This quick grasp of change rates is vital for staying a step ahead in Mzansi’s busy markets.
Understanding what a derivative is forms the backbone of grasping how changes occur in various real-world situations. For traders and investors, recognising how small shifts impact value helps in making faster, clearer decisions. Whether analysing stock movements or measuring profit growth, knowing the basics of derivatives offers practical tools to predict and respond to trends effectively.
The derivative represents the instantaneous rate at which one quantity changes with respect to another. Put simply, it's the mathematical tool that tells you how a function behaves as its input shifts by tiny amounts. For example, if you track a share price against time, the derivative tells you the share's speed in rising or falling right at any moment, not just over a whole day or week.
This concept is particularly useful because it bridges raw data and actionable insight. Understanding the derivative allows financial professionals to move beyond static figures and see the trajectory. So, the derivative doesn't just give a number; it gives direction and momentum, enabling informed strategies.
The relationship between a function and its derivative is fundamental. The function itself shows the overall value or position, while its derivative reveals how fast that value is changing. Think of it like driving: the function is your car’s current location, while the derivative corresponds to your speedometer reading. Both are crucial — one tells you where you are, the other how quickly you’re moving.
The idea of the instantaneous rate of change means measuring how fast something changes at a precise point, not across an interval. For instance, in economics, this could mean the exact rate of increase in costs the moment a new tax kicks in, rather than the average over months. It's a finer granularity of information, which is vital for precision in decision-making.
This notion is more accurate and relevant than average rates because many processes do not change linearly. An example would be the acceleration of a taxi — its speed goes up or down moment to moment. The instantaneous rate, captured by the derivative, captures these details that averages would miss.
Another way to grasp derivatives is through the slope of a curve. When you plot a function on a graph, the derivative at any point is the slope of the tangent line touching the curve exactly there. So, if the slope is steep, the function's value is changing rapidly; if it’s flat, the change is slow or zero.
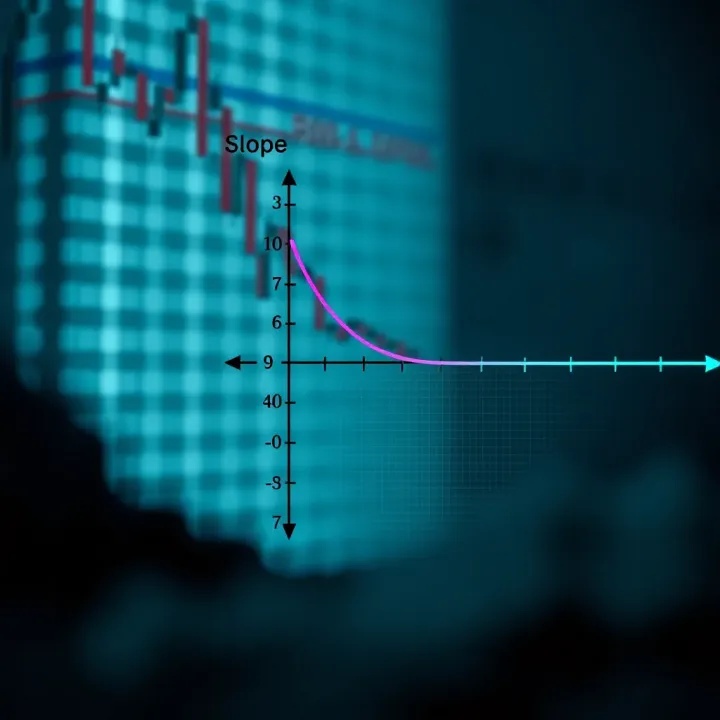
In trading terms, this helps identify moments of sharp price movements versus stable phases. Understanding that slope means you can spot turns in trends or potential breakpoints, improving your timing on buys and sells.
The derivative isn't just a maths concept — it's a practical lens to view and react to changes that matter in finance and beyond.
In short, knowing derivatives equips you with a sharper, more dynamic view of how values evolve, helping investors and analysts to stay ahead in fast-moving markets.
Understanding the fundamental rules of differentiation is vital for anyone dealing with derivative functions. These rules streamline the process of finding derivatives, making calculations more manageable and applicable in analysing various real-world scenarios. For investors and analysts, grasping these basics can transform complicated rate-of-change problems into straightforward solutions.
The power rule is the backbone of differentiation when handling polynomials, which are common in financial models such as growth projections or trend lines. It states that if you have a function where x is raised to a power n, its derivative is n times x raised to the power of (n-1). For example, the derivative of f(x) = x⁴ is f'(x) = 4x³. This rule drastically simplifies calculating slopes or rates of change in investment returns where polynomial functions frequently appear.
When a function has a constant multiplied by another function, the derivative can be found by simply multiplying the constant by the derivative of the function itself. For instance, if f(x) = 5x², then f'(x) = 5 * 2x = 10x. In financial contexts, this rule is useful when scaling results, such as adjusting rates for currency conversion or applying a fixed multiplier to growth rates.
These rules allow differentiation to be done term by term. If a function is a sum or difference of multiple parts, differentiate each term separately. For example, the derivative of f(x) = x² + 3x - 7 is f'(x) = 2x + 3. This approach breaks complex functions into manageable components, which is especially helpful when analysing portfolios with combined assets or multiple income streams.
When you have two functions multiplied together, their derivative isn't just the product of their derivatives. The product rule takes care of this by stating: the derivative of u(x)*v(x) is u'(x)*v(x) + u(x)*v'(x). Take for example, f(x) = x² * eˣ, where you multiply a polynomial by an exponential. This rule helps traders model scenarios where different factors influence each other, such as price-time combinations.
For functions divided one by another, the quotient rule provides a way to differentiate accurately. It says the derivative of u(x)/v(x) is (v(x)*u'(x) - u(x)*v'(x)) divided by v(x)². For example, if f(x) = (x² + 1) / (x - 1), using this rule lets you find how ratios—common in financial ratios like price-to-earnings—change over time.
The chain rule is essential when differentiating composite functions, where one function is inside another. It advises first differentiating the outer function, keeping the inner function intact, then multiplying by the derivative of the inner function. For instance, for f(x) = (3x + 2)⁵, the derivative is 5(3x + 2)⁴ * 3. This rule is invaluable in complex models where rates depend on nested factors, such as calculating compound interest or risk-adjusted returns.
Mastering these fundamental rules moves you beyond textbook calculus and into practical applications, enabling clearer insight in trading strategies, portfolio risk assessment, and financial forecasting.
Understanding derivatives of common functions is fundamental for traders, investors, and financial analysts. These derivatives provide the tools to analyse how changes in market variables affect asset prices, interest rates, or profit margins. Grasping these concepts helps predict trends, assess risk, and make informed decisions based on the behaviour of financial instruments modelled by such functions.
Derivatives of simple polynomials are straightforward yet powerful in analysing linear and nonlinear growth. For example, the derivative of a function like f(x) = 3x² reveals the instantaneous rate of change as 6x. This gives a clear picture of how a portfolio or investment might accelerate or decelerate in value with respect to time or other variables.
Examples with multiple terms expand this to more complex scenarios, such as f(x) = 4x³ - 2x + 7. Here, the derivative f'(x) = 12x² - 2 captures varying rates of change within the same trend, helping financial analysts understand when an asset might hit inflection points that signal opportunity or caution in decisions.
Sine and cosine derivatives are important in market cycles and seasonal trend analysis. Derivatives like d/dx[sin(x)] = cos(x) and d/dx[cos(x)] = -sin(x) model oscillations, such as commodity price fluctuations influenced by seasonal demand. Having this insight allows you to forecast short-term turning points more accurately.
Other trigonometric functions like tangent, secant, cosecant, and cotangent also have their derivatives, valuable in specialised cases. For example, the derivative of tan(x) is sec²(x), which can model steep changes in momentum or volatility spikes — essential for day traders or risk managers monitoring sharp shifts.
Derivative of exponential functions is crucial for understanding compounding effects. The exponential function f(x) = e^x has the elegant property that its derivative remains e^x, which models continuous growth — such as interest accruing on investments or inflation over time. This helps investors grasp how small changes can compound into significant effects.
Logarithmic differentiation basics assist with functions involving products, quotients, or powers where direct differentiation is tricky. For instance, differentiating y = x^x requires rewriting as y = e^x ln x before applying derivatives. This technique proves valuable in quantitative finance when dealing with complex formulas relating variables in market pricing or portfolio optimisation.
Mastering derivatives of these common functions equips financial professionals to handle a wide range of market scenarios, turning mathematical insight into practical decision-making tools.
By focusing on these core derivative types, traders and analysts can dissect market behaviour with clarity, moving beyond guesswork to precise evaluation of trends and risks.
Understanding how derivative functions work outside textbooks is vital, especially for traders, investors, and financial analysts who rely on real-time data shifts. Derivatives help to capture the subtle changes in trends, prices, and risk, providing a straightforward way to measure how variables move in relation to one another.
The slope at any point on a curve reflects the derivative's value there, representing the instantaneous rate of change. For instance, if a share price grows steadily and you want to know how quickly it’s changing at exactly 10 am, the derivative gives that precise slope. This measure helps traders gauge momentum and make quicker decisions.
Once the slope at a point is known, the tangent line equation expresses this local behaviour mathematically. It acts like a linear approximation near that point, allowing prediction of values without recalculating the entire curve. Asset managers frequently use tangent line equations to predict short-term price movements or to model risk exposure over a narrow time frame.
Critical points occur where the derivative equals zero, marking potential peaks or troughs in a function. For a financial asset’s price, this means identifying possible maximum or minimum values that hint at resistance or support levels. Detecting such points early allows investors to optimise entry or exit positions.
The second derivative clarifies whether a critical point is a maximum, minimum, or a point of inflexion. If the second derivative is positive, the critical point is a minimum, indicating the asset price could rise from there. If negative, it’s a maximum, suggesting a price drop might follow. This insight helps traders manage risk more precisely.
In physics, velocity is the derivative of position concerning time, and acceleration is the derivative of velocity. For example, measuring how quickly a bakkie accelerates on a highway involves derivatives. While this might seem remote from finance, similar concepts appear in market momentum studies, where acceleration might signal changing rates in price trends.
Derivatives are fundamental in economics for optimising costs and profits. Businesses examine marginal cost (the derivative of total cost) and marginal revenue (derivative of total revenue) to decide production levels. For financial analysts, knowing these helps predict profit maximisation or minimise losses — critical when advising clients on investment or business strategies.
Derivatives provide direct, quantifiable insights into how variables change over time, proving essential in decision-making where time and precision matter.
By mastering these applications, financial professionals can sharpen their analysis, anticipate market moves, and offer well-informed guidance.
🤖 Explore no loss derivative bots in trading: how they operate, their benefits, risks, and impact on South African markets for savvy investors.

Explore the 5ers trading program 📈 manage funded accounts, master risk, and compare options. Get tips to boost your trading success today! 💡

Explore synthetic trading in South Africa 🇿🇦: learn how to mimic asset payoffs, build strategies, weigh risks, and navigate regulations for smarter investing 💼📊.

Explore the Five ERs framework 📘 and learn how each element applies in real-life scenarios. Gain practical tips to understand and use these key principles effectively.
Based on 10 reviews