

Understanding Synthetic Trading in South Africa
Explore synthetic trading in South Africa 🇿🇦: learn how to mimic asset payoffs, build strategies, weigh risks, and navigate regulations for smarter investing 💼📊.
Edited By
Henry Wilson
The Moving Average Convergence Divergence (MACD) is one of the most popular tools used by traders to spot changes in a stock or market’s momentum. But it’s not just a matter of flipping a switch and expecting magic. Understanding the MACD settings—the specific parameters used to calculate its lines—is key to making reliable, timely decisions.
Most retail trading platforms, including those popular in South Africa like EasyEquities or TradingView, set the MACD to a default of 12, 26, and 9. These numbers represent the periods for the fast EMA (Exponential Moving Average), slow EMA, and the signal line respectively. While these defaults suit many scenarios, blanket use without tweaking might leave traders missing clearer signals or getting false alarms.
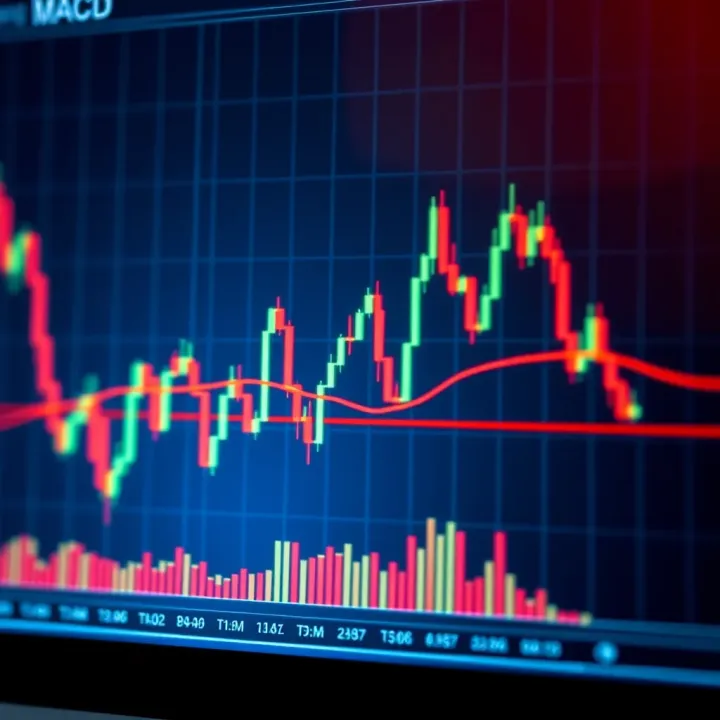
For example, shorter settings such as 5, 13, and 6 can make the MACD more sensitive. This is useful in fast-moving markets like forex pairs involving the South African Rand (ZAR/USD or ZAR/EUR), where timing can be tight. On the other hand, longer settings, like 19, 39, and 9, smooth out the noise in volatile markets—helping investors stay grounded during wild JSE swings.
Remember, no single MACD setting fits all. Traders must tailor the parameters based on their trading style, the asset class, and market conditions to get the best out of this indicator.
Practical tips for adjusting MACD settings:
Test different timeframes: Day traders might prefer sensitive settings for quick entries and exits, while long-term investors lean towards the standard or longer EMAs.
Backtest your strategy: Use historical data on locally listed shares or ETFs to see how the MACD settings might have affected past performance.
Watch market phase: Rising trends may require different settings than choppy or sideways markets; adjusting settings can reduce whipsaws.
In short, grasping how the MACD settings influence the speed and reliability of signals allows traders to adapt their charts to South African markets effectively. It’s not just about what the lines show but how you set them up that sets you apart.
The Moving Average Convergence Divergence (MACD) is a popular trading tool that helps traders identify changes in momentum and trend direction. Getting familiar with its components is essential for using this indicator effectively. By understanding what each part measures and how they interact, traders can better time entries and exits, especially in dynamic markets like those in South Africa.
MACD highlights the difference between two moving averages, signalling shifts in the trend’s strength and direction. For example, when a shorter-term moving average rises above a longer-term one, MACD captures that momentum shift early. This helps traders spot potential highs or lows ahead of time, which is especially handy in volatile markets such as the JSE.
The MACD relies on two exponential moving averages (EMAs) — typically the 12-day and 26-day. These smooth out price action to remove noise while keeping recent data in focus. The shorter EMA responds faster to price changes than the longer one, which creates the convergence or divergence signals traders watch. This interplay gives a clearer picture of whether buyers or sellers are gaining ground.
The MACD line is simply the difference between the fast (shorter) and slow (longer) EMAs. It oscillates around the zero line, showing the current momentum. For instance, if the line crosses above zero, it's a quick indicator that bullish momentum might be picking up.
The signal line is a 9-day EMA of the MACD line itself. Traders use it as a trigger for buy or sell decisions. When the MACD line crosses above the signal line, it often signals a buying opportunity; crossing below suggests weakening momentum or a possible sell signal. This smoothing helps avoid reacting to every minor fluctuation, providing more reliable signals.
The histogram plots the difference between the MACD line and the signal line, making momentum changes easier to see at a glance. When bars grow taller, momentum is accelerating; shrinking bars warn of a slowdown. Think of the histogram as a visual cue for gauging the strength behind moves, smoothing out the chatter for more confident decision-making.
Understanding these components clearly lays the groundwork for adjusting MACD settings to your trading style and market conditions, improving your chances of successful trades.
The MACD indicator is valued for its ability to smooth out market noise and reveal underlying trends. However, the effectiveness of the MACD largely depends on its settings. Adjusting the periods used in calculating the moving averages can significantly change how the indicator reacts, thereby impacting trading decisions. Understanding these common settings and their effects helps traders apply the MACD more effectively across different market conditions.
The typical MACD settings use periods of 12, 26, and 9. To break it down: the MACD line is based on the difference between the 12-period and 26-period exponential moving averages (EMAs). Then, a 9-period EMA of the MACD line acts as the signal line, which traders often watch to spot buy or sell signals.

These numbers originated decades ago and became standard because they strike a balance between sensitivity and reliability. In practice, the 12 and 26 EMAs track shorter and longer-term price trends respectively, while the 9-period signal line helps filter out false moves. For example, on a daily chart of the JSE Top 40, this setup can usually catch meaningful momentum shifts without overwhelming traders with spurious signals.
These standard settings work well in various markets because they adapt reasonably to common price rhythms. Whether it’s Shares on the JSE, commodities, or forex, 12, 26, and 9 tend to capture the ebb and flow within typical trading cycles. The 12 and 26 periods correspond roughly to half a month and a little over a month's worth of trading days respectively, which complements monthly market behaviour.
That doesn’t mean they’re perfect for every case. But they offer a reliable starting point, especially for traders who prefer a balanced view rather than one skewed aggressively towards short-term noise or overly sluggish signals.
For short-term trading, reducing these periods can make MACD more responsive. For instance, setting the periods to 6, 13, and 5 increases sensitivity to recent price moves. Day traders and scalpers may prefer this, as it helps spot quick reversals. However, this also means more false signals, so additional confirmation like volume or price action becomes crucial.
On the flip side, long-term investors often extend these periods, possibly to 24, 52, and 18, making the MACD less twitchy and better suited to broad market trends. This slower MACD will filter out short-term fluctuations, enabling investors to focus on sustained momentum shifts tied to economic cycles or structural changes.
The choice also depends on market volatility. In volatile markets like the South African rand against the US dollar, shortening the MACD periods can capture rapid swings better. Conversely, in stable markets, sticking with or lengthening the standard settings reduces whipsaws. Traders adapting to Eskom-driven loadshedding or political announcements may tweak settings based on historical reaction times to such events.
Adjusting MACD settings isn't about finding a one-size-fits-all solution. Instead, it's about tuning the indicator to your trading style and the specific market nuances you face.
Understanding these settings and their practical effects equips you to make smarter decisions, whether you're reading the JSE Top 40, rand crossings, or global indices.
Selecting MACD settings that suit your trading strategy can make a real difference in your results. The idea is not to rely blindly on default numbers but to fine-tune parameters that reflect your trading style and the market conditions of the instruments you’re working with. A one-size-fits-all approach rarely holds up, especially in dynamic markets like South Africa’s.
Volatility plays a big role in deciding your MACD settings. If you’re trading shares listed on the JSE that swing wildly due to rand fluctuations or global investor sentiment, you might want shorter moving averages in your MACD. These react quicker to price changes, helping you catch early signals. On the other hand, for more stable instruments like government bonds or certain blue-chip stocks with less daily movement, longer periods help filter out noise, reducing false signals.
In essence, volatile markets benefit from settings like a faster 8, 17, 9 MACD, while calmer markets might be better served by standard or even longer duration settings such as 12, 26, 9 or 15, 30, 10. This avoids whipsaws and keeps trades aligned with real trends, which matter especially when market jitters come into play.
Your trading timeframe is just as crucial. Day traders working off 15-minute charts need a MACD that captures short-lived momentum, so faster parameters make sense. Swing traders with daily or 4-hour charts benefit from settings that smooth out noise and highlight medium-term trend shifts.
For example, if you’re a short-term trader following shares like Sasol or Kumba Iron Ore through intraday moves, an aggressive MACD might alert you quicker to potential entries and exits. But if you’re investing for months or years, say in ETFs tracking the Top 40 Index, slower settings preserve your position through short blips and reduce unnecessary churn.
Before settling on any MACD configuration, it’s smart to test how these parameters perform against past price data. Backtesting simulates trades using historical charts, giving you a feel for whether your chosen settings catch significant moves or produce too many false alarms.
For instance, if you adjust the MACD to a faster setting for the South African platinum sector, backtesting will show if this change results in better entry signals that improve profits or if it just leads to losses from noise. This trial-and-error approach is practical and necessary for building confidence in your strategy.
Backtesting is like a rehearsal before the live show—it can save you from costly mistakes.
Several platforms offer backtesting capabilities accessible to local traders. For example, EasyEquities allows retail investors to test strategies on South African shares without extra cost. More advanced tools like MetaTrader 5 and TradingView provide extensive MACD customisation and support local brokers.
Additionally, platforms such as ThinkMarkets and IG Markets offer global and South African asset classes with integrated backtesting. These make it easier to tweak MACD settings and observe how minor adjustments could improve your trading edge.
Choosing the right platform depends on your familiarity with the interface and the instruments you want to trade. Many of these allow you to export data for deeper analysis or set alerts based on your MACD parameters, keeping things manageable without staying glued to your screen.
Trading South African markets requires a clear understanding of local factors that influence price movements. The MACD (Moving Average Convergence Divergence) indicator remains a useful tool, but tweaking its settings with local conditions in mind can improve its effectiveness. Focusing on aspects like rand volatility and Eskom loadshedding helps traders better time their entries and exits. Additionally, combining MACD signals with other analysis tools ensures a more comprehensive view, reducing the risk of false signals.
The South African rand is known for its fluctuations, often reflecting global trends, commodity prices, and domestic political developments. This volatility impacts the JSE and currency pairs involving ZAR. When using MACD, keep in mind that sudden swings in the rand can cause abrupt price shifts unrelated to underlying trends. For example, an unexpected rand weakness following SARB policy announcements might trigger MACD crossover signals, but these could be short-lived spikes rather than sustained moves.
Adjusting MACD settings to shorter timeframes or reducing the lookback periods can make the indicator more responsive to rapid rand shifts, giving you earlier warning signs. However, increased sensitivity might also mean more false alarms. A balanced approach involves pairing MACD results with additional confirmation, such as volume spikes or support and resistance levels.
Loadshedding disrupts business operations and trading activity, sometimes causing delayed market reactions or unusual intraday price movements. When power outages hit during trading hours, liquidity may thin out, making MACD signals less reliable due to erratic price data.
Traders should take note of Eskom's stage schedules and plan around expected loadshedding periods. For instance, if loadshedding usually occurs in the evening after close of market, some of the next-day price gaps or volatility might relate to overnight developments affected by power outages. Monitoring trading volumes and extending observation periods before acting on MACD signals can reduce misinterpretations caused by these disruptions.
MACD alone can sometimes give mixed signals, especially in sideways or choppy markets. Combining it with the Relative Strength Index (RSI) helps quantify overbought or oversold conditions, enhancing trade timing. For example, a bullish MACD crossover supported by an RSI below 30 suggests a stronger buy opportunity than MACD alone.
Similarly, using simple or exponential moving averages alongside MACD can clarify trend direction. If MACD signals a buy but the price remains below the 50-day moving average, it may be better to hold off, as the broader trend might still be bearish.
Market news and economic fundamentals often trigger sharp movements unrelated to technical setups. South Africa’s market reacts strongly to political shifts, commodity price changes, and policy announcements.
Before acting on MACD signals, check relevant news — for example, a positive MACD crossover during a mining shares rally might be confirmed by rising commodity prices or strong export data. Conversely, if MACD indicates a buy but new mining regulations surface raising concerns, it’s wise to pause and reassess. Integrating fundamental context with technical signals avoids jumping the gun and supports more informed decisions.
Practical use of MACD in South Africa means adapting to local quirks — from rand shifts to loadshedding — and blending technical indicators with the on-the-ground pulse of news and market conditions.
Overfitting happens when traders tweak MACD parameters so tightly to past market data that the settings lose practicality in live trading. It’s tempting to adjust the moving averages or signal line periods to fit historical price action perfectly, but this often leads to false confidence. For example, a setting that worked well during 2020's rand volatility may not perform when the market shifts due to different economic factors.
Balancing flexibility with robustness means finding MACD settings that respond well to varying market conditions without overreacting to noise. Instead of chasing specific numbers, stick to commonly tested periods like 12, 26, and 9 as a starting point. Traders should use these as a foundation but allow minor adjustments to suit their timeframe and instrument. This approach helps maintain reliability across different trading environments.
Relying solely on MACD signals can mislead traders because the indicator doesn’t consider the wider market picture or the strength behind price moves. For instance, a bullish crossover on the MACD without context might trigger a buy signal, but if the broader market is choppy or under pressure from news events, that signal might fail. Understanding market conditions—whether the JSE is under pressure or local news is causing sharp price swings—adds crucial perspective.
Volume confirmation is essential for validating MACD signals. A move supported by rising trading volume indicates genuine market interest, whereas a crossover on thin volume could be a poor signal. Take a situation where the MACD indicates upward momentum, but volumes are falling; this divergence often warns traders to be cautious. Combining MACD with volume analysis can prevent costly mistakes and improve the timing of entries and exits.
Tip: Always pair your MACD readings with volume data and keep an eye on local market news to avoid taking signals at face value.
In sum, avoiding the traps of overfitting and ignoring volume or context improves the usefulness of MACD indicators. South African traders who bear these points in mind are better placed to make informed, balanced decisions even when markets are volatile or unpredictable.
Explore synthetic trading in South Africa 🇿🇦: learn how to mimic asset payoffs, build strategies, weigh risks, and navigate regulations for smarter investing 💼📊.

📊 Get to know Maven Trading's roots, tech, pros and cons, plus regulatory factors. Ideal for South African traders seeking clear, practical investment insights.

📈 Discover how synthetic indexes work, their benefits & risks in trading, and what South African investors should know about these unique financial tools.

⚡ Master HFX trading in South Africa: grasp fast forex deals, key tech, and risks for savvy investors looking to move swiftly in volatile currency markets.
Based on 6 reviews